
Platform Analytics Overview
On this page
In this lesson, you will learn:
- What Platform Analytics is
- How it’s different from a single report
- How Platform Analytics and Performance Analytics fit together
1 Beyond one report
In Chapter 22, you built single reports. But a manager usually wants to see many numbers together, and see how they change over time. That’s what Platform Analytics is for. 📈
Key term: Platform Analytics
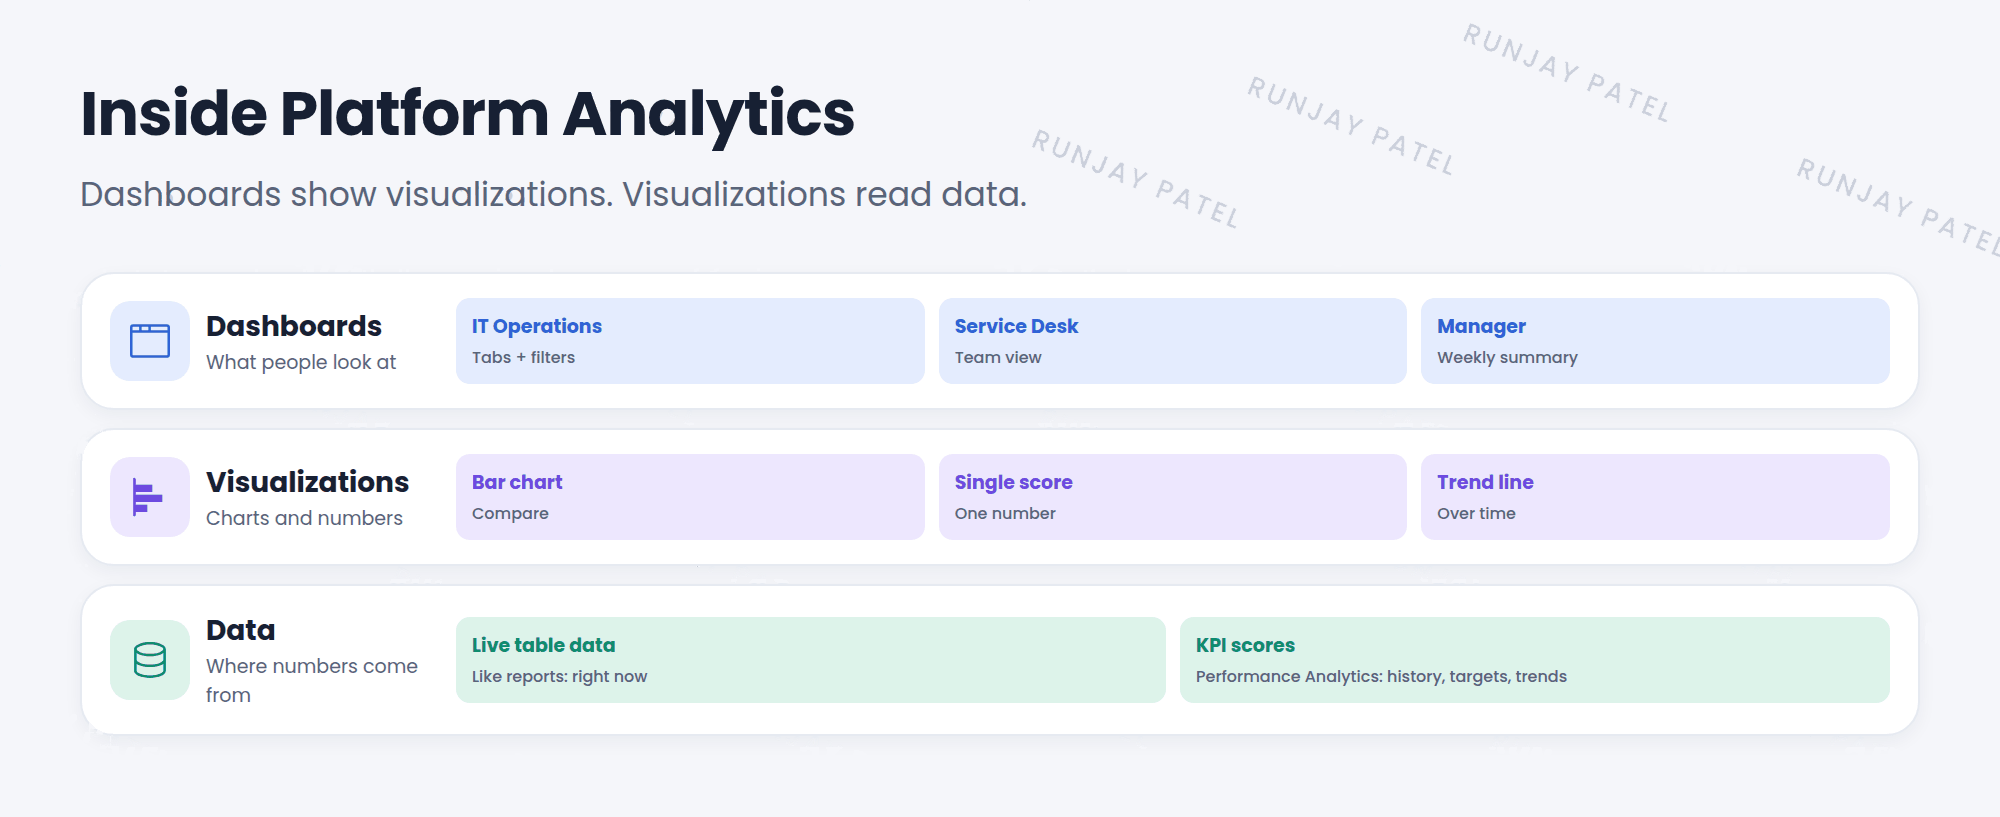
ServiceNow’s modern place for data: dashboards, visualizations, and KPIs, all in one experience.
2 What’s inside
| Part | What it is |
|---|---|
| Dashboards | Pages with many charts, tabs, and filters (Lesson 23.2) |
| Visualizations | The charts and numbers on a dashboard |
| Indicators (KPIs) | Numbers measured over time, like “open incidents each day” (Lesson 23.3) |
| Libraries | Lists of saved dashboards, visualizations, and KPIs |
3 Platform Analytics vs Performance Analytics
These two names sound alike. Here’s the difference:
Platform Analytics
The experience: where you build and look at dashboards and visualizations. Every instance has it.
Performance Analytics
The engine for KPIs. It collects scores every day, so you can see history, targets, and trends. Full use needs a license.
📝 Note: ServiceNow keeps moving reports and dashboards into the Platform Analytics experience. In newer releases, classic dashboards and Performance Analytics content are managed from there too. Menu names may differ a little between releases.
⭐ Remember: A report answers “what now?”. KPIs answer “how is it changing?”.
4 Let’s try it: look around
- Click All and type
platform analytics. Open it (it may be called Platform Analytics or Analytics Center). - Find the Library. Look at the Dashboards list.
- Open any ready-made dashboard. Count how many visualizations it has.
5 Quick recap
- Platform Analytics is the modern place for dashboards and visualizations
- Performance Analytics collects KPI scores over time
- Dashboards show many visualizations together
- Reports show now. KPIs show change over time
6 Check yourself
Think of your answer first. Then tap to check.
1 Which one collects scores every day to show trends: Platform Analytics or Performance Analytics? Show answer
Performance Analytics.
2 What is a dashboard? Show answer
A page that shows many visualizations together, with tabs and filters.
3 Your manager asks, “Are open incidents going down this quarter?” Report or KPI? Show answer
A KPI (indicator), because it shows change over time.
Nice work! You finished this lesson. 🎉
Was this lesson helpful?
Please log in to share lesson feedback.
Have a question or doubt?
Ask here and get help from instructors and fellow learners.
Only logged-in learners can post.